Welcome: ColorSpace 400-886-3881 400-886-3381
Language:
 ∷
∷

∷
∷

ISO 12233: 2014 E-SFR Test Overview:
Our proprietary,ISO-compliant SFRpuls charts are designed to work with Imatest software to provide automated,comprehensive image quality analysis.
Imatest ISO 12233:2014 E-SFR charts are implementations of the Low Contrast Edge SFR (E-SFR) test chart illustrated in Section 6.1 and Annex C of the ISO Standard Document.
Imatest SFRplus performs highly automated measurements of several key image quality factors using a specially-designed test chart that may be purchased from the Imatest store (recommended) or printed on a high-quality inkjet printer. The user does not need to manually select Regions of Interest (ROIs).
The chart is available in three general versions:
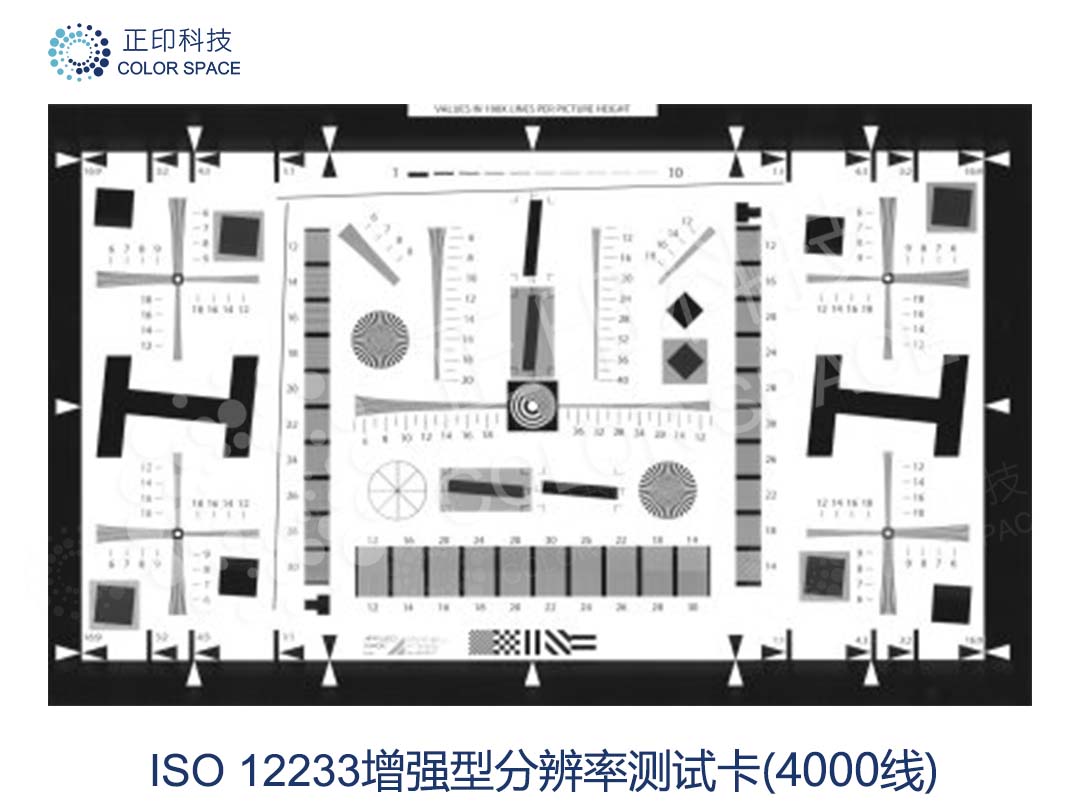
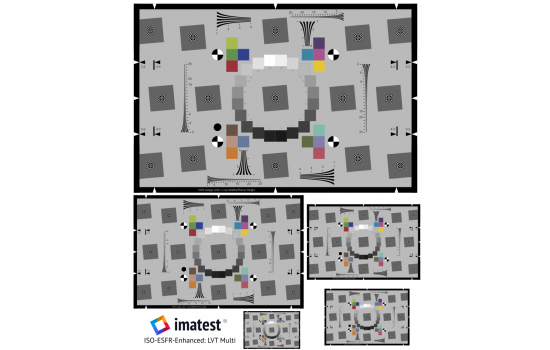
Enhanced Version
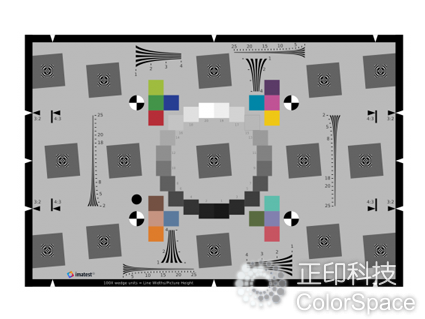
 The Imatest Enhanced ISO 12233:2014E-SFR chart has all the features of the Standard chart, keeping the3:2 aspect ratio, with the addition of six added slanted squares for measuring performance near the image boundaries and hyperbolic wedges for visual analysis or analysis with the Imatest Wedge module. It also has 16 color patches when produced with technologies that allow color. Since these additions are in regions of the chart not covered by the standard, compliance with the standard is unaffected.
The differences between the Imatest charts and the chart illustrated in the standard are listed below. Even with these differences the Imatest chart is in full compliance with the standard.
1. A 20 patch OECF gray-scale pattern* is used as opposed to the 16 patch version.The differences between the Enhanced and Standard Versions are as follows:
1. Six extra slanted squares are added for measuring performance near the image boundaries.This chart will work with the fully-automated eSFR ISO module, starting with the Imatest 4.0 release.
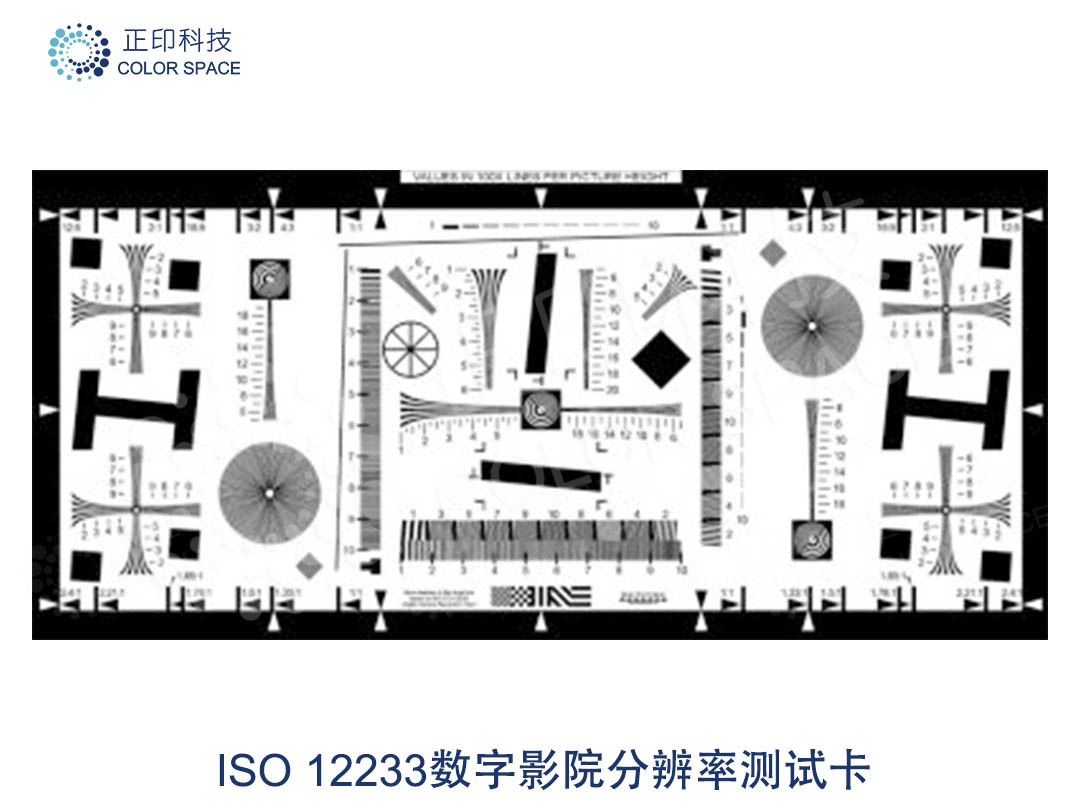
Extended Version
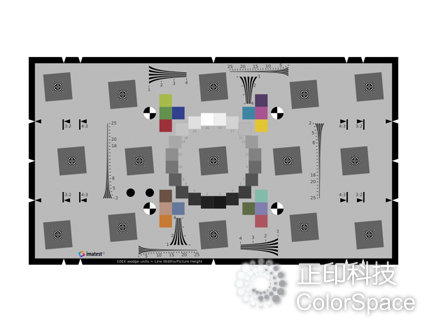
 The Imatest Extended ISO 12233:2014E-SFR chart has all the features of the Enhanced chart (six extra squares, wedges, and 16 color patches where possible), but has a 16:9 aspect ratio, which makes it suitable for HDTV and cinema measurements (and it also works well with 3:2 aspect ratio DSLRs). It is fully compliant with the standard.
This chart will work with the fully-automated eSFR ISO module, starting with the Imatest 4.0 release.
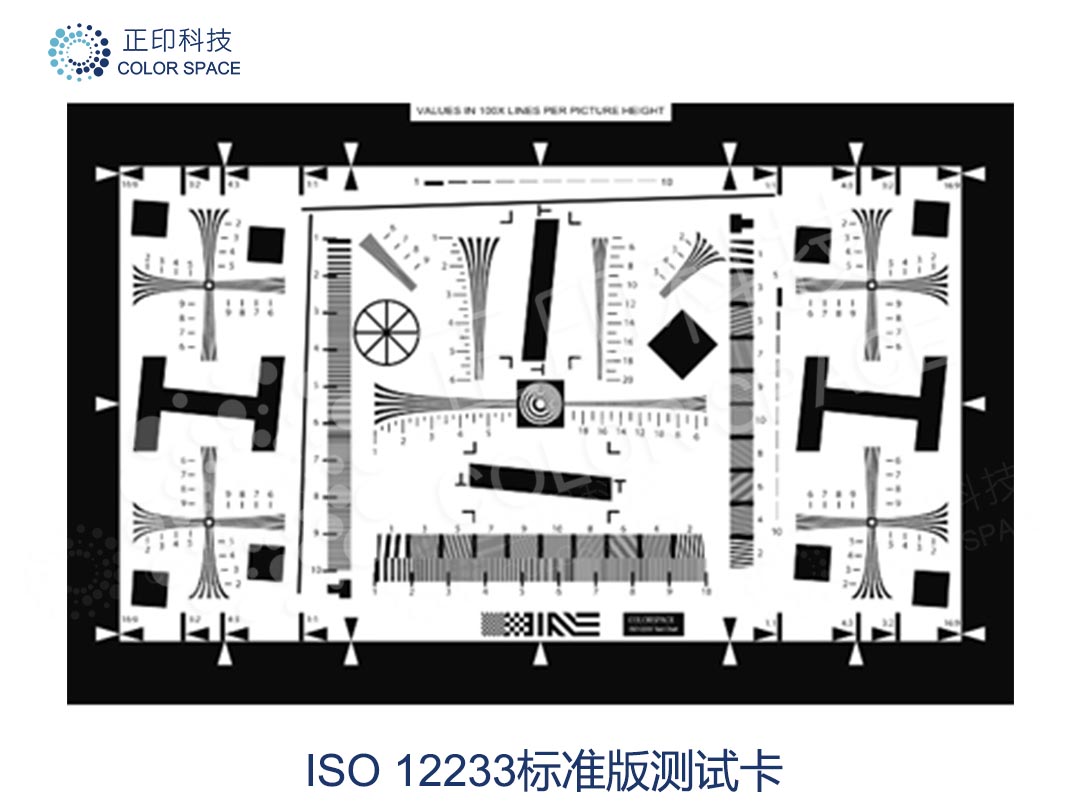
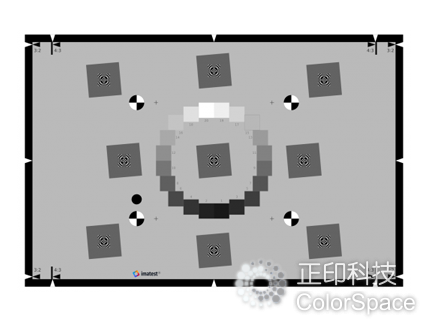
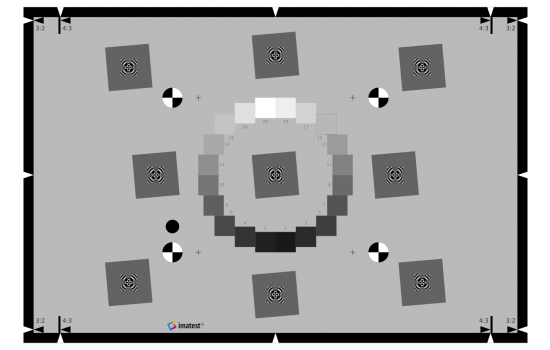 This chart, which has a 3:2 aspect ratio, is a "no-frills" implementation of the standard. For most work we recommend the Enhanced or Extended charts, which have additional edges for measuring performance near the image boundaries, as well as hyperbolic wedges and color patches (where the technology allows). These charts maintain full compliance with the standard.
The Imatest Standard ISO12233:2014E-SFR chart closely resembles the Low contrast E-SFR test chart illustrated in section 6.1 and Annex C of the ISO standard document, with a few differences, all of which are fully compliant with the ISO standard.
This chart will work with the fully-automated eSFR ISO module, starting with the Imatest 4.0 release.
Details:
|
Chart Size |
Standard |
Enhanced |
Extended |
|
1x |
200 mm × 305 mm 7.875" × 12" |
200 mm × 305 mm 7.875" × 12" |
200 mm × 365 mm 7.875" × 14.5" |
|
2x |
400 mm × 610 mm 15.75" × 24" |
400 mm × 610 mm 15.75" × 24" |
400 mm × 730 mm 15.75" × 29" |
|
4x |
800 mm × 1220 mm 31.5" × 48" |
800 mm × 1220 mm 31.5" × 48" |
800 mm × 1460 mm 31.5" × 58" |
For more information about the lighting system and its many options, please contact us. If you would like to learn more about a complete lab setup, please visit our Image Quality Lab Setup page.
Contact: sales@colorspace.com.cn
Phone: 15817270587
Tel: 400-886-3881(周一至周五 9:00~18:00)
Email: sales@colorspace.com.cn
Add: South Building #2-1101, Lv Di Qi Hang Office Building, Hou Sha Yu, Shun Yi District, Beijing, China