Welcome: ColorSpace 400-886-3881 400-886-3381
Language:
 ∷
∷

∷
∷
Dot Pattern Test Chart
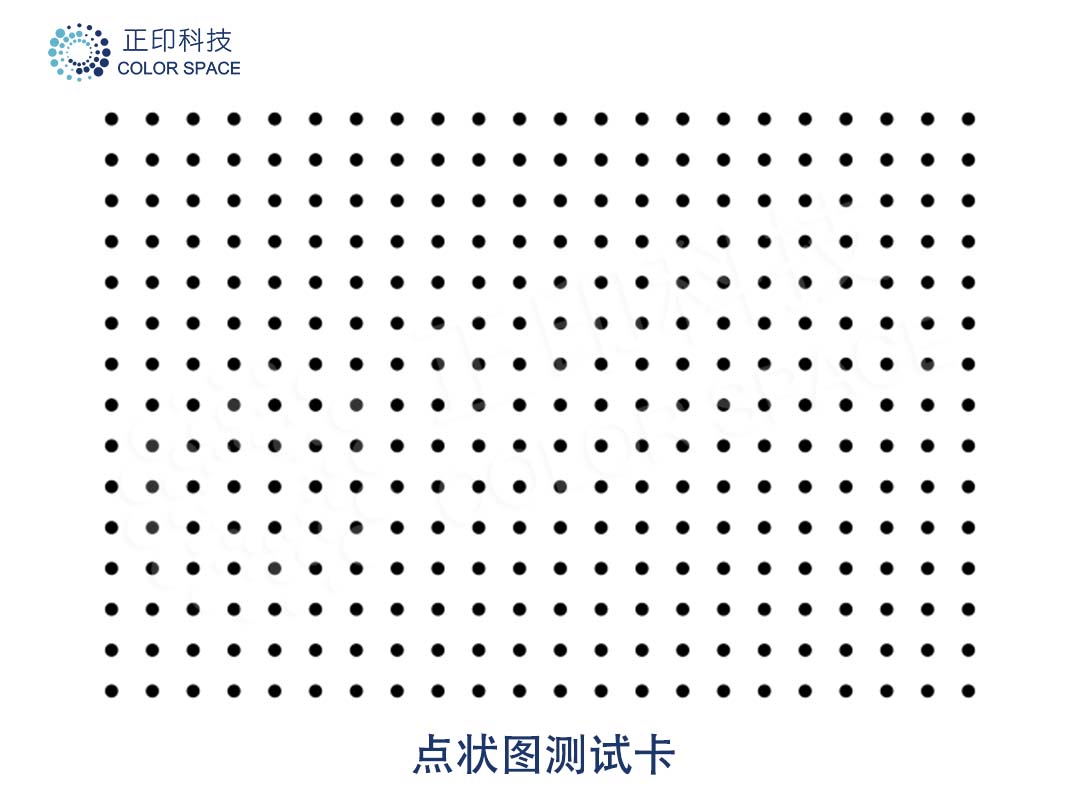
The CS-TC005 Dot Pattern Test Chart features a regular dot pattern for analyzing geometric distortion, lateral chromatic aberration, and field of view (FOV) in lenses and imaging systems.
The chart is available in 1X, 2X, and 4X configurations, with different chart and dot sizes to accommodate different lens fields of view, working distances, and imaging test setups. It can be used for image quality testing of industrial vision systems, security cameras, automotive imaging systems, consumer imaging devices, and other optical imaging applications.
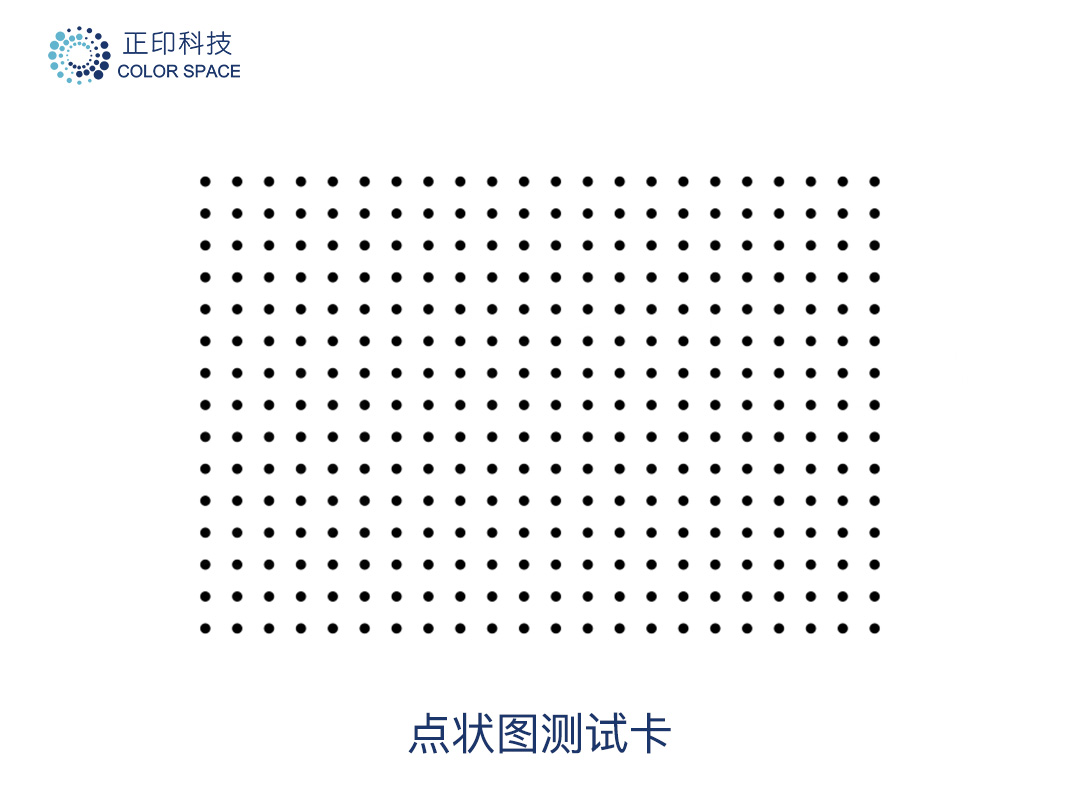
The chart consists of regularly arranged circular dots distributed across the test area. The dot positions provide spatial reference points for analyzing lens distortion and lateral chromatic aberration across the image field.
By comparing the image positions of corresponding dots across different color channels, the chart can be used to evaluate lateral chromatic aberration at different image field positions.
The dot pattern can be used for geometric distortion analysis, including SMIA TV Distortion and related lens distortion measurements.
SMIA TV Distortion is a commonly used metric for evaluating geometric distortion in imaging systems and lens testing.
Combined with the physical chart dimensions, lens-to-chart distance, and image analysis results, the chart can be used to calculate or evaluate the field of view (FOV) of an imaging system.
The CS-TC005 is available in 1X, 2X, and 4X configurations. Different chart dimensions and dot sizes allow the chart to be selected according to the lens field of view and test distance.
For testing, the CS-TC005 is positioned within the field of view of the lens or imaging system and captured under the required test conditions. Image analysis software is then used to detect the positions of the dots.
By analyzing the image coordinates of dots across the test field, the chart can provide data for evaluating:
The specific test procedure, analysis region, and calculation method should be determined according to the applicable test standard, image analysis software, and test setup.
Specifications
| Parameter |
Dot Pattern Test Chart |
||||
| Model |
CS-TC005 |
||||
| Configuration | 1X | 2X | 4X | ||
| Chart Size |
280mm × 210mm |
900mm × 600mm |
1600mm × 1000mm | ||
| Dot Size |
2.364mm × 2.364mm |
7.6mm × 7.6mm |
13.511mm × 13.511mm |
||
| Dot Pitch |
7.373mm |
23.7mm |
42.111mm |
||
| Dot Pattern |
37 rows × 25 columns |
||||
| Chart Type | Reflective | ||||
【Reserve a Lab】For more information about related products and testing services, please contact:sales@colorspace.com.cn

Follow [ColorSpace] for industry news/events/solutions
Contact: sales@colorspace.com.cn
Phone: 15817270587
Tel: 400-886-3881(周一至周五 9:00~18:00)
Email: sales@colorspace.com.cn
Add: South Building #2-1101, Lv Di Qi Hang Office Building, Hou Sha Yu, Shun Yi District, Beijing, China